Calling code
+243
Calling code
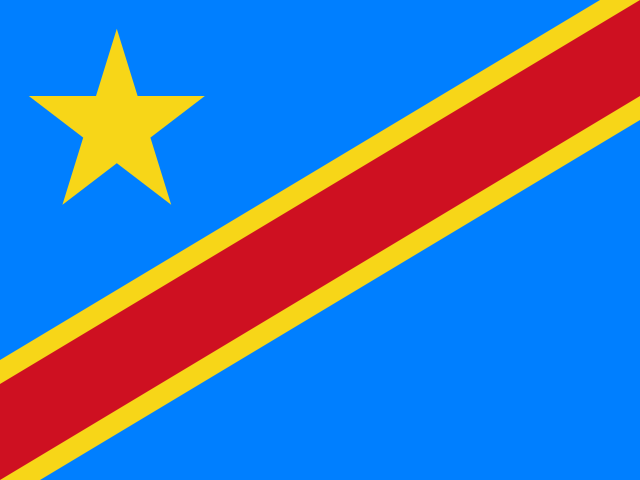 DR Congo trade data
DR Congo export data was $35.01B in goods exported during 2025.

Calling code
+243
Calling code
Capital
Kinshasa
Commercial and policy center
Currency
CDF
Congolese franc
Population
109.3M
Latest public estimate
Product blocks are sized by the latest available public category values and partner charts use verified country-share context.
Annual value
Atlantic and Congo River gateway for containers, fuel, machinery, food, medicines, and Kinshasa-bound cargo.
High-value copper, cobalt, mining equipment, vehicles, and industrial cargo route through the southern mining belt.
Indian Ocean and regional transit access for minerals, fuel, construction inputs, food, and cross-border consumer goods.
Value, share, and trader signal are arranged for quick product review.
Refined copper, cathodes, copper anodes, and copper-linked mining exports
Cobalt hydroxides, cobalt oxides, metal compounds, and battery-material supply
Copper ores, cobalt-linked ores, tin ores, and mineral concentrates
Gold, diamonds, precious metals, and high-value mineral goods
Petroleum products and small-volume energy-linked export cargo
Cocoa beans, cocoa products, and agriculture export demand
Specialty base metals and mining-linked material exports
Timber, wood products, charcoal, and forest-product exports
Zinc ores, zinc goods, and mineral export niches
Coffee and specialty agriculture export flows
| Rank | Product | Value | Share | Trader signal |
|---|---|---|---|---|
| 01 | Copper | $23.30B | 66.5% | Refined copper, cathodes, copper anodes, and copper-linked mining exports |
| 02 | Inorganic chemicals and cobalt compounds | $6.04B | 17.2% | Cobalt hydroxides, cobalt oxides, metal compounds, and battery-material supply |
| 03 | Ores, slag, and ash | $3.16B | 9.0% | Copper ores, cobalt-linked ores, tin ores, and mineral concentrates |
| 04 | Pearls, precious stones, metals, and coins | $1.78B | 5.1% | Gold, diamonds, precious metals, and high-value mineral goods |
| 05 | Mineral fuels and oils | $214.5M | 0.6% | Petroleum products and small-volume energy-linked export cargo |
| 06 | Cocoa and cocoa preparations | $182.5M | 0.5% | Cocoa beans, cocoa products, and agriculture export demand |
| 07 | Other base metals and cermets | $68.3M | 0.2% | Specialty base metals and mining-linked material exports |
| 08 | Wood and articles of wood | $63.2M | 0.2% | Timber, wood products, charcoal, and forest-product exports |
| 09 | Zinc | $39.5M | 0.1% | Zinc ores, zinc goods, and mineral export niches |
| 10 | Coffee, tea, mate, and spices | $23.9M | 0.1% | Coffee and specialty agriculture export flows |
DR Congo export data includes bill of lading number, shipment date, HS code, product description, exporter and importer details, total weight, package and container details, destination countries, ports of loading and discharge, shipment value, and currency where available.
Join 5,000+ businesses using EximDataHub to discover buyers, review trade lanes, and spot market shifts.