Explore the latest export insights, HS codes, and global trade trends shaping Chile’s position in 2025. This guide explains Chile’s major export products, top partners, and new opportunities for businesses that want to enter international markets with confidence.
🔹 Introduction
Chile has steadily built a strong global trade reputation, driven by its mineral wealth, agricultural diversity, and stable economic policies. In 2024, Chile’s exports crossed USD 90 billion — with copper, fruits, fish products, forestry goods, and chemicals leading the list.
The country’s solid trade network with Asia, North America, and Europe helps maintain consistent export demand even in changing market conditions.
For exporters planning ahead for 2025, understanding Chile’s export structure, HS-coded products, and fast-growing destinations is essential. This blog covers Chile’s top export categories, market trends, HS codes, and partner insights — helping businesses identify real opportunities based on verified trade signals.
🔹 What Are Chile’s Major Exports?
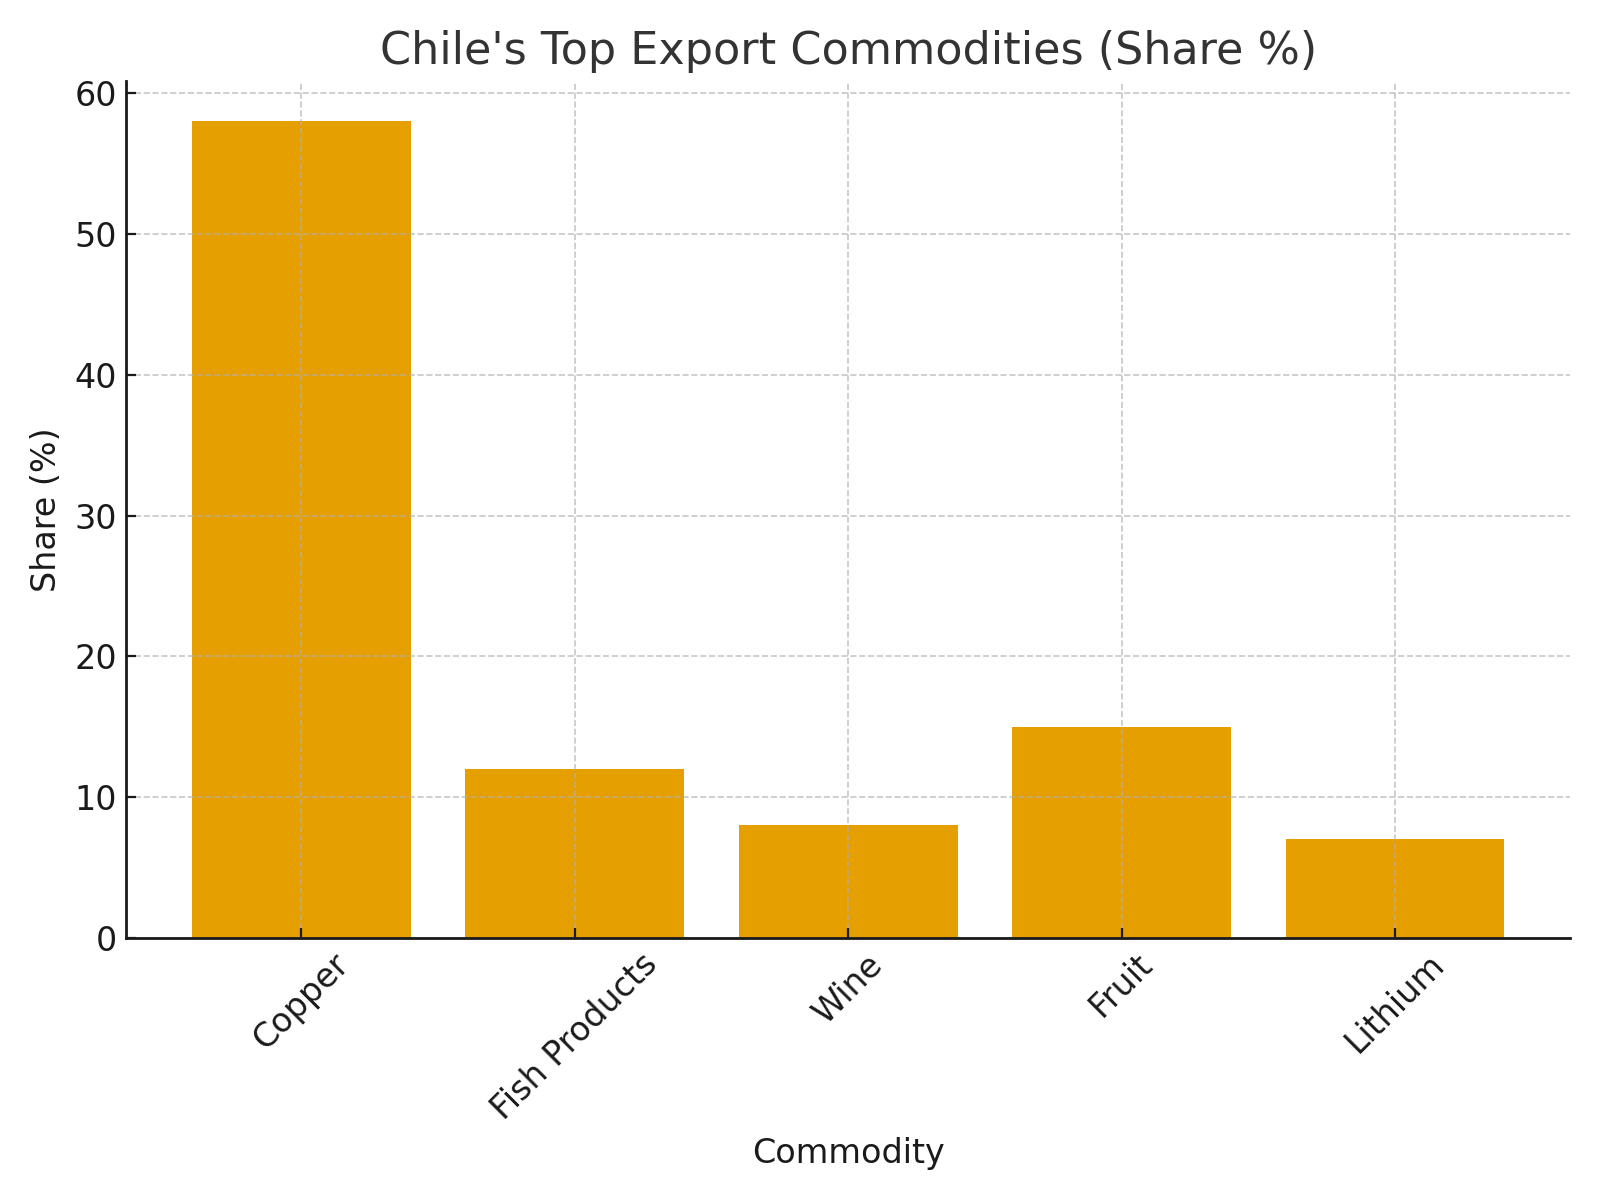
Chile’s export base is well-known for its mining sector, but agriculture and manufacturing have also grown strongly. Below are the core export segments that shape the country’s trade identity.
➤ Copper & Mineral Products – Copper ore, refined copper, and molybdenum make up a large share of Chile’s export value, mainly shipped to China, Japan, and South Korea.
➤ Fresh Fruits (Cherries, Grapes, Apples) – Thanks to its climate, Chile is a leading fruit exporter, with strong demand from the U.S., Europe, and Asia.
➤ Fish & Seafood – Salmon, fishmeal, crustaceans, and canned seafood remain high-value exports, especially to North America and East Asia.
➤ Forestry Products – Wood pulp, timber, and paper products are supplied to China, the U.S., and Europe.
➤ Chemicals & Lithium – As part of the EV supply chain, Chile exports lithium carbonate, nitrates, and industrial chemicals to global technology markets.
These export segments show how Chile balances natural resources with rising agro-industrial capabilities.
🔹 Key Market Trends in Chile
| Market Driver | Description |
|---|---|
| ➤ Growth in Clean Energy Minerals | High demand for lithium and copper due to EV and battery production. |
| ➤ Agro-Export Expansion | Blueberries, cherries, and avocados are gaining market share in Asia & the U.S. |
| ➤ Diversification Across Asia | Shipments increasing to South Korea, India, and Indonesia. |
Market Insight
Chile’s copper sector continued to dominate in 2024, accounting for nearly half of the country’s total export revenue. Demand from East Asia — led by China and Japan — pushed annual shipments of refined copper and ore higher compared to the previous year.
On the agriculture side, cherry and grape exports saw strong growth due to rising demand from China and the U.S. Increasing consumption of fresh fruits and healthy foods boosted volumes, with seasonal shipments reaching record highs. To verify year-wise data, exporters often compare trends using tools like the International Trade Centre Trade Map
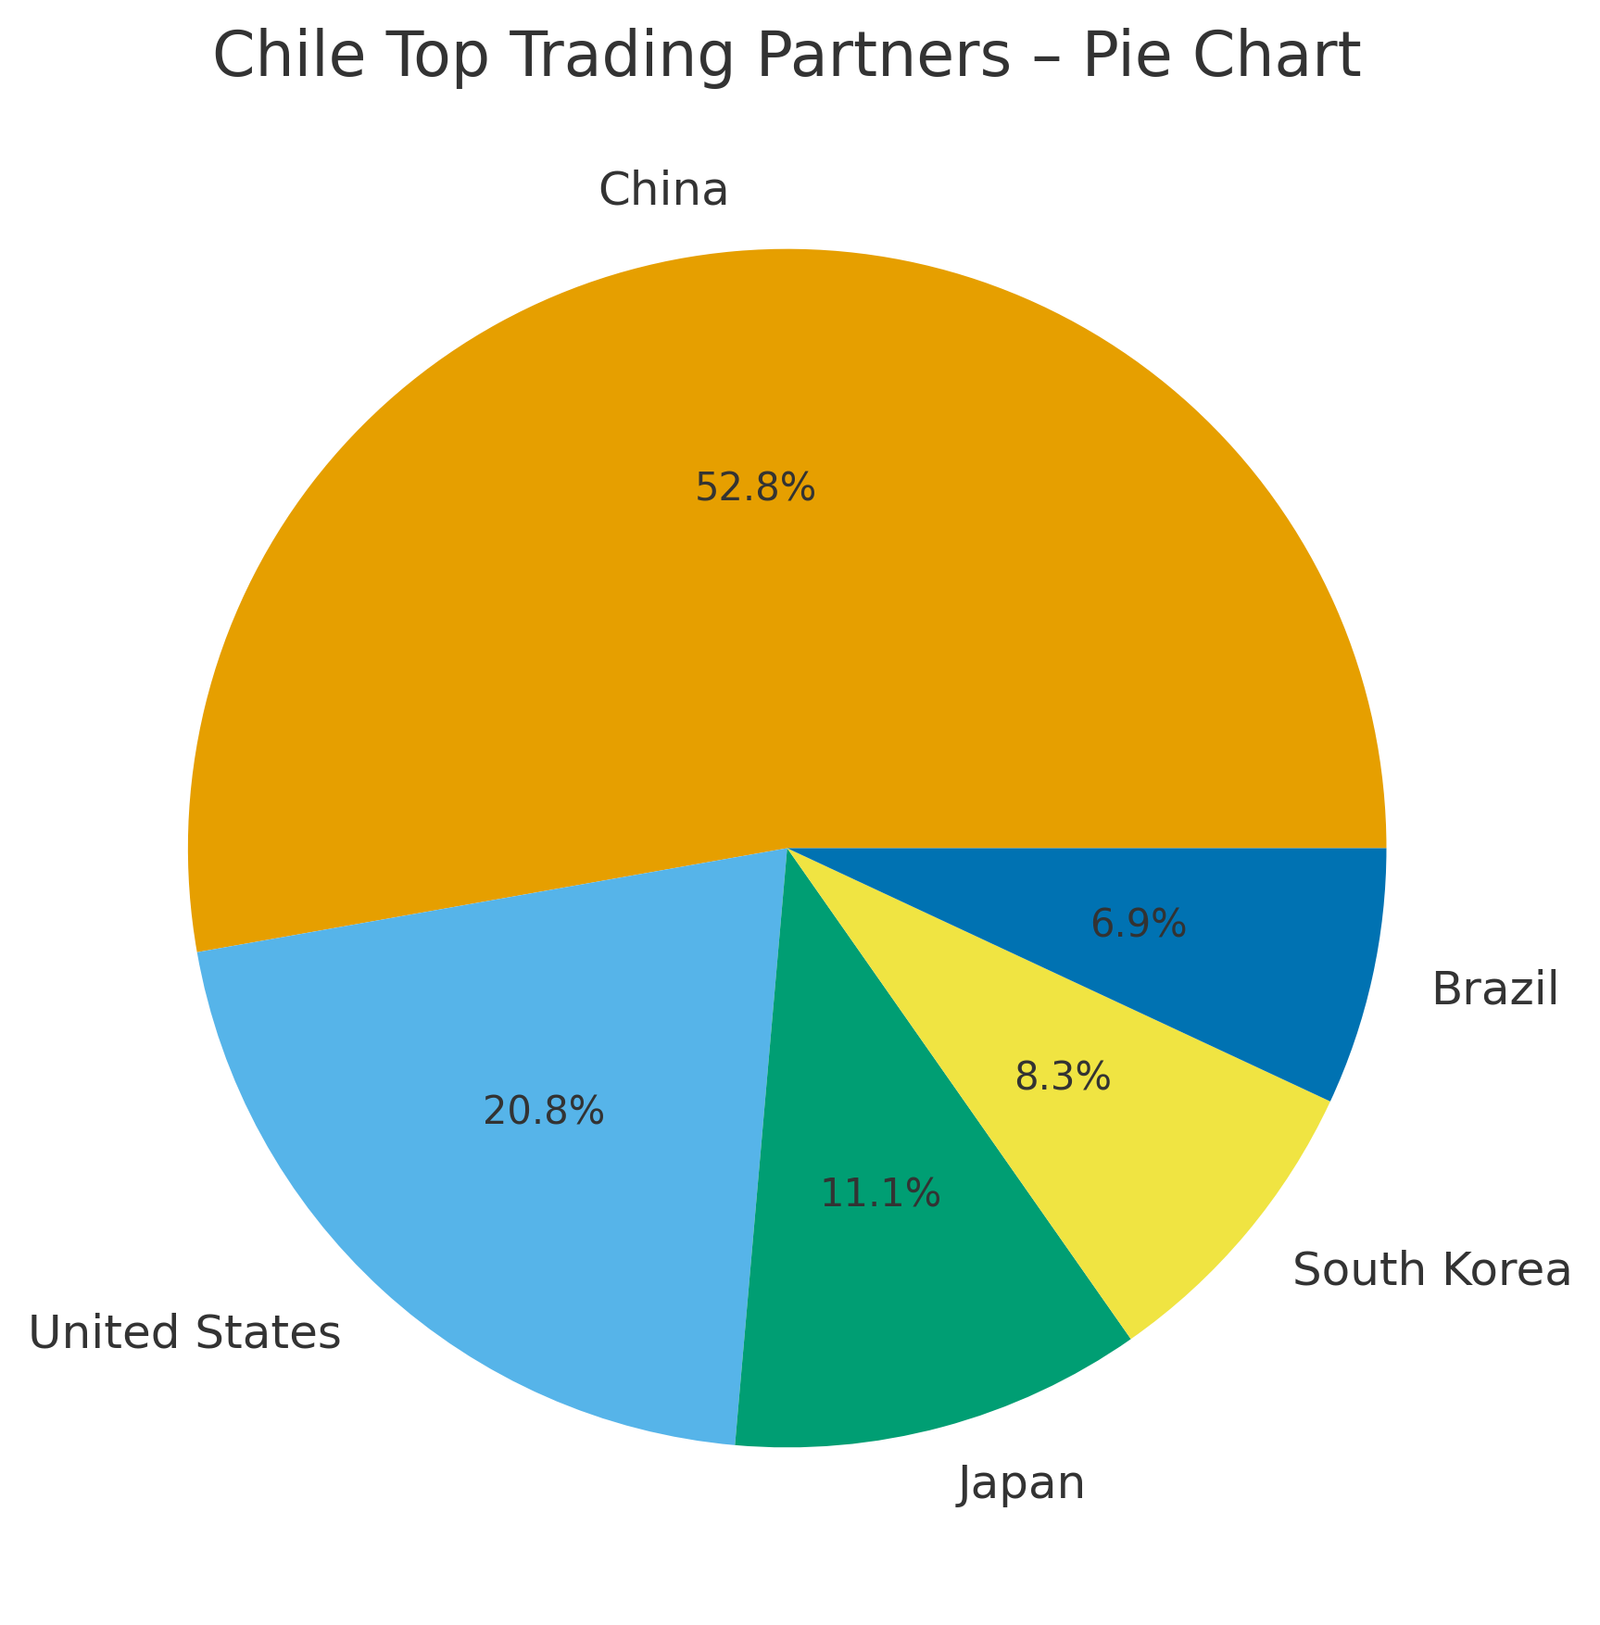
🔹 Top Trading Partners of Chile (2024–25)
| Destination | Share of Total Exports (%) |
|---|---|
| ➤ China | 38% |
| ➤ United States | 15% |
| ➤ Japan | 8% |
| ➤ South Korea | 6% |
| ➤ Brazil | 5% |
China remains Chile’s largest partner due to massive demand for copper, fruit, and chemicals.
The U.S. maintains strong demand for salmon, wood products, grapes, and cherries.
Japan and South Korea focus heavily on minerals and seafood, while Brazil leads in regional industrial trade.
🔹 Opportunities for Exporters
Exporters entering Chile’s trade ecosystem in 2025 can explore several promising opportunities:
➤ EV & Battery Supply Chain – Lithium, copper, and industrial chemicals have high global demand.
➤ Seasonal Fruit Exports – Strong off-season supply of cherries, apples, and grapes helps meet global shortages.
➤ Value-Added Seafood – Canned fish, fish oil, salmon portions, and ready-to-cook products are rising globally.
➤ Sustainable Forestry Products – Certified wood pulp and paper products gain premium pricing.
➤ Data-Driven Trade Planning – Exporters using real-time verified analytics from EximDataHub.com gain better access to importer networks and HS code clarity.
🔹 HS Codes for Chile’s Major Exports
Below are common HS codes linked to Chile’s top segments:
➤ 26030000 – Copper ores and concentrates
➤ 71081200 – Gold, unwrought
➤ 16041300 – Prepared or preserved fish
➤ 08092900 – Fresh cherries
➤ 28369100 – Lithium carbonate
Using accurate HS codes helps exporters avoid clearance problems and calculate tariffs correctly. If needed, traders can cross-check codes using the ITC Trade Map or get assistance through EximDataHub.com.
🔹 How Exim Data Hub Helps Exporters
| Feature | Exporter Benefit |
|---|---|
| ➤ HS Code Intelligence | Accurate classification helps avoid customs delays. |
| ➤ Buyer/Seller Insights | Access verified importers across 100+ countries. |
| ➤ Forecast Reports | Understand demand patterns and future opportunities. |
| ➤ Compliance Support | Helps exporters follow updated documentation rules. |
With Exim Data Hub, exporters can track demand, find buyers, and plan shipments using verified, structured data — essential for entering competitive markets.
🔹 Conclusion
➤ Chile’s strong export base — led by copper, fruits, seafood, and lithium — continues shaping global supply chains.
➤ Growing demand in Asia, the U.S., and Europe provides stable opportunities for businesses in 2025.
➤ Exporters who understand HS codes, destination patterns, and trade trends can scale faster with fewer risks.
➤ Verified market intelligence from EximDataHub.com enables smarter planning and faster expansion.
Want to export smarter?
Use Exim Data Hub to plan confidently, connect globally, and grow with clarity.
🔹 Frequently Asked Questions (FAQ)
Q1: Which country is Chile’s largest export partner?
➤ China — mainly for copper, fruits, and chemicals.
Q2: What are Chile’s top export products?
➤ Copper, lithium, cherries, salmon, grapes, and wood pulp.
Q3: Which sectors will grow in 2025?
➤ Clean-energy minerals, agro-exports, and value-added seafood.